portera
Remote logs
portera 🚀
portera🚀 provides remote logs for you node apps with an awesome style :).
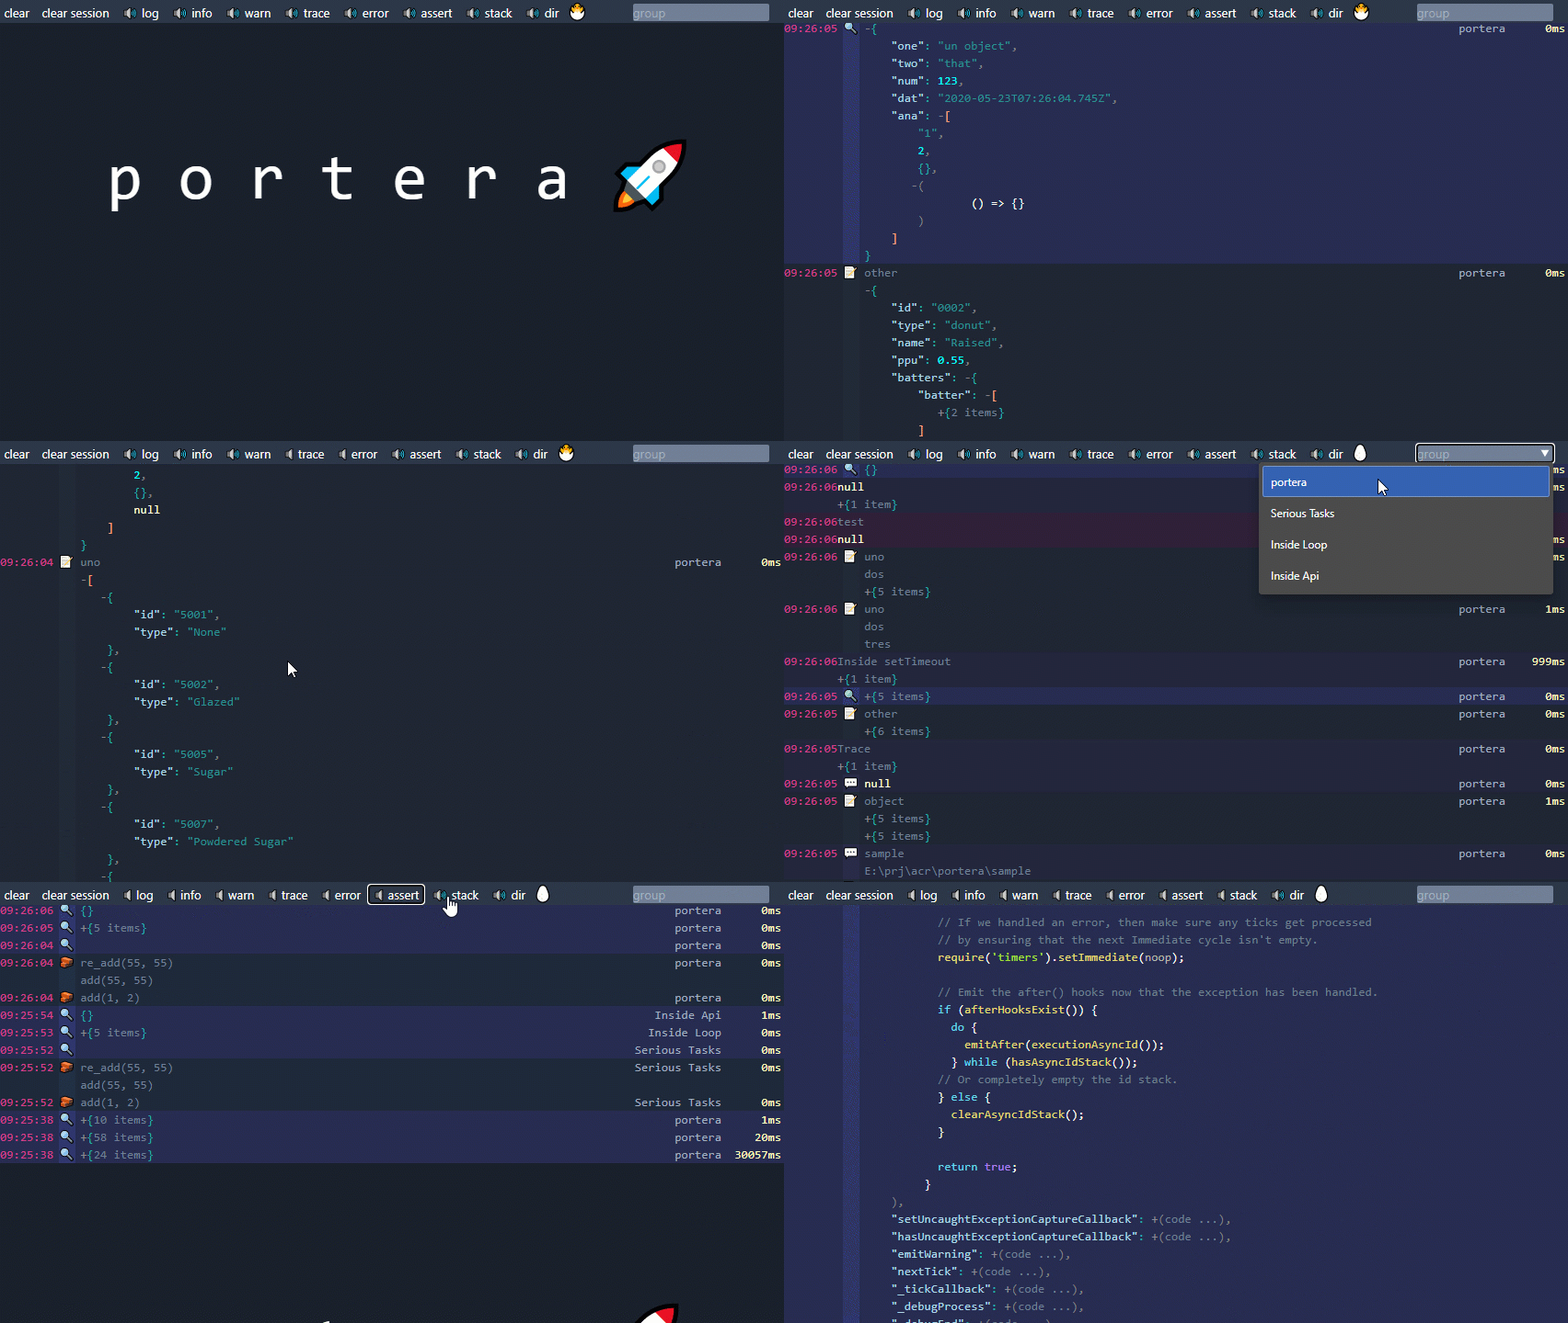
portera has two parts, a library that wrap your console object by default, redirecting the output to portera server, its receive your data and serve a web page where you can display an awesome output, just like that

Installation
Install portera in your dev environment, or better -g (globally) in your toolbox
$ npm install portera --save-dev
Use
Whithout any configuration just import portera in your project,
const portera = require("portera");

// whithout any configuration
// portera should wrap console
// and use localhost:3001 as default host
portera();
Or portera using a more detailed configuration
const portera = require("portera");

// console outputs will be send by portera
// use your own ip:port
portera({
  host: "http://localhost:3001",
  obj: console,
  use: process.env.NODE_ENV === "production" ? [] : null,
});
Also you can keep your current console object and create/use a new one
const portera = require("portera");
const debug = {}
portera({
  host: "http://localhost:3001",
  obj: debug,
  performance: 0
});

debug.log(...)
debug.info(...)
Portera configuration
hostwhere portera server is running by defaulthttp://localhost:3001objthe object to use by defaultconsoleperformancetime in ms to obtain data performance by default 0 that is disableduse- an optional array with name methods, that should be added or replaced by default if not specified contains all["log", "info", "warn", "error", "assert", "trace", "btrace", "stack", "dir"]nouse- an optional array with the name of methods that should emptyed
You can use portera as development tool and later in other environment select the methods that you want.
const portera = require("portera");
portera({
  use: ["btrace", "stack", "dir", "close"],
  nouse: ["log"]
});

console.dir(...) // portera dir method
console.info(...) // console default method
console.log(...) // will be hidden {}
console.close() // gracefully close socket
portera should use defaults for host, object, and performance and only will be added to console the specified methods in use option, default methods from console keep untouched except log that is is specified in nouse will remain hidden. You can mantain this in your code but deactivated.
Portera server
portera server runs on port 3001 by default, you can change this using an argument when execute portera, see below. Once running you can open your favorite browser using portera address http://
Run portera server
$ npx portera
Once running you will see portera output both in the server console and in the web client. To use the amazing web client you can open your favorite browser using the portera address http://<portera_server_ip>:3001
Portera web client
By default portera show three levels of json, you can change this using an argument in the url with the parameter ?l=. Try others like ?l=0 or ?l=5
http://localhost:3001/?l=2
ms displayed on the right of the log page are time made between calls in your source program, the time is taken before to emit the event
Current data session are stored in the browser using your local machine storage you can delete this using “clear session” button on top, meanwhile you can clear your screen using “clear” button, but the data will be there next time you reload the page.
Portera performance monitor
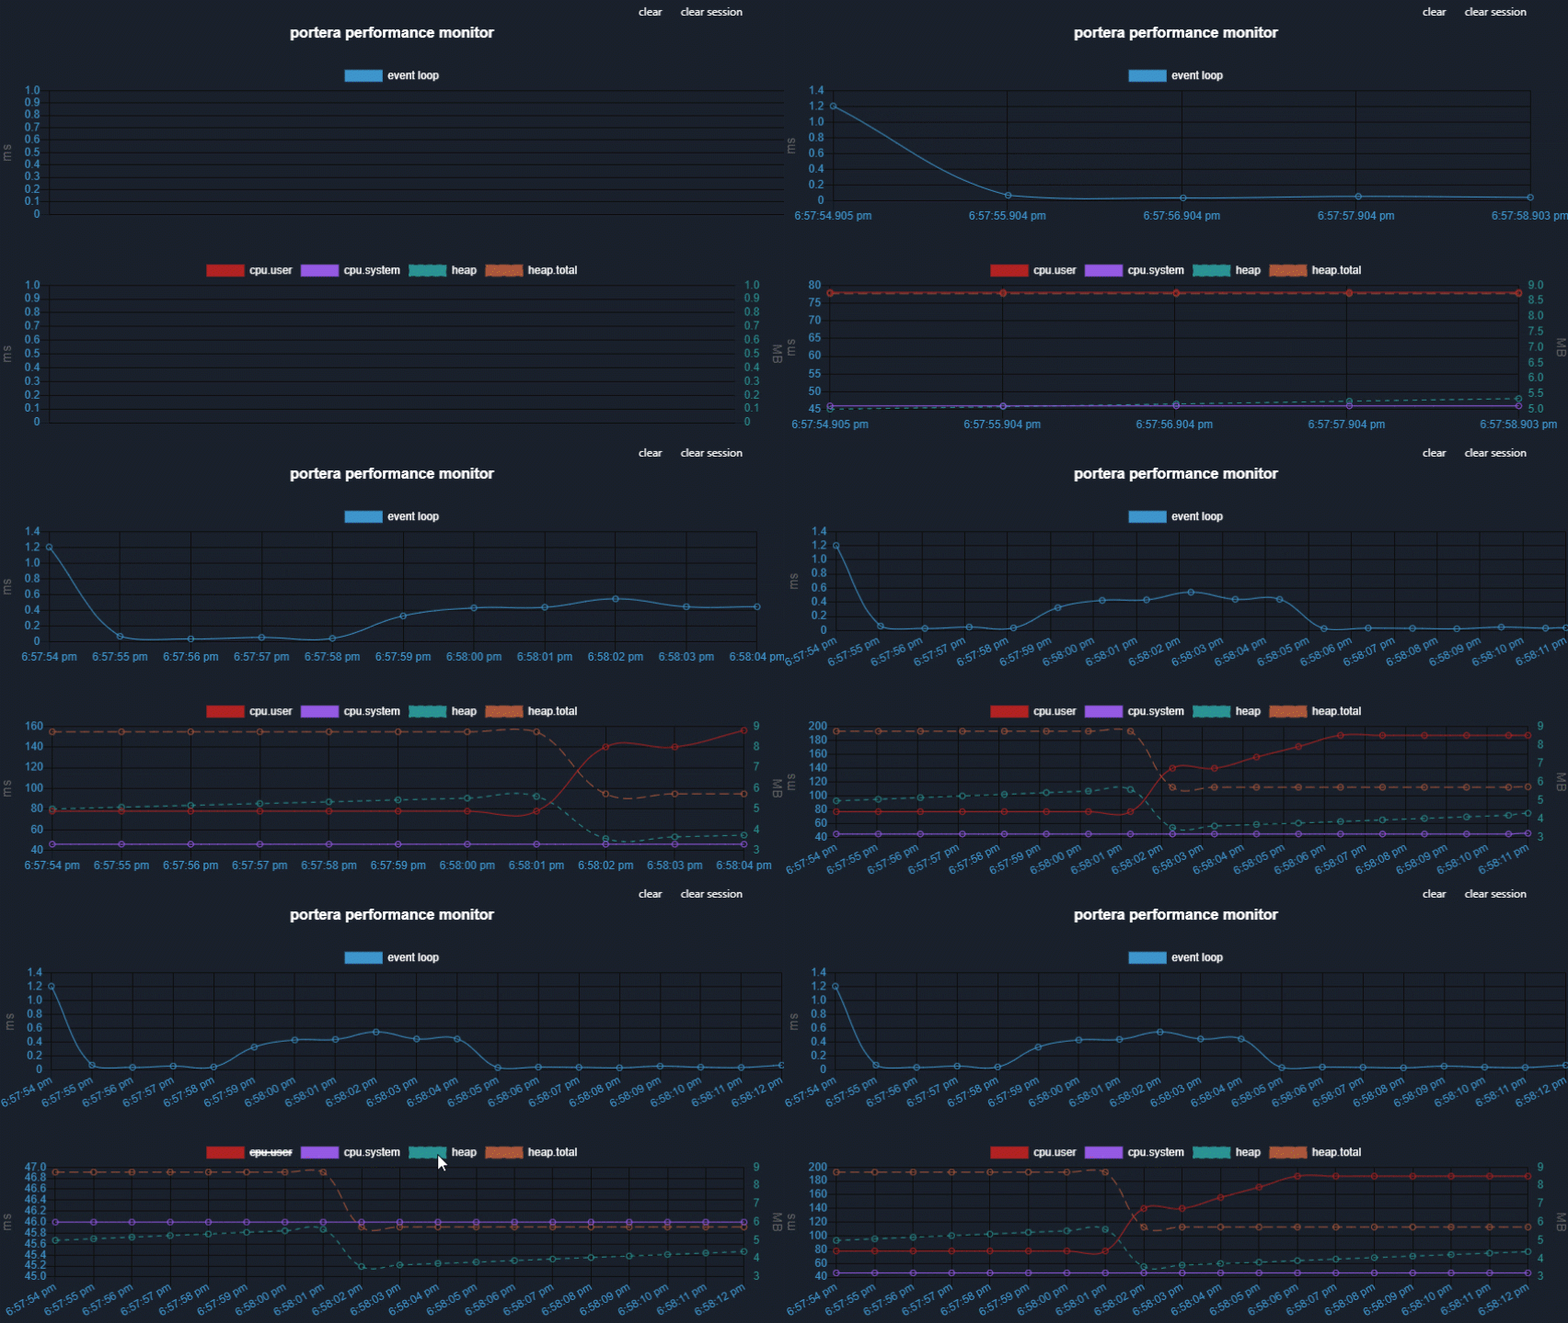
I added it to show some cpu & memory data that node offers via proccess. To reach performance data add /performance to your server url and setup performance parameter in portera configuration
http://localhost:3001/performance

Data is collected each time specified in the performance parameter when portera is initialized. Time should be expressd in ms. By default is disabled 0. I recommend values beginning from 1000 (1s)
event.loopthe even loop lag in mscpu.usercpu user time in ms-
cpu.systemcpu user time in ms heapmemory used by the heap in megabytesheap.totalmemory available in the heap in megabytes
I’m sure that there are great tools to measure performance for node applications, it is only a little toy because was paying again. Please check lib/portera.js performance function and bin/public/performance/performance.js to check how this data is collected and showed. Feel free to comment anything.
Portera methods
Will have the same behaviour than known original ones.
portera.log(...)
portera.info(...)
portera.warn(...)
portera.error(...)
portera.trace(...)
portera.assert(...)
portera.dir(...)
portera add some other interesting functions
portera.group(...) // name your groups
portera.stack() // trace showing only functions called previously
portera.btrace(...) // better trace - still working on it
If no group is specified portera group everything under “portera” group, once a group is specified next calls will be tagged inside of that group while no other is specified.
Inside of portera web you can filter groups using regexp. Enjoy!!
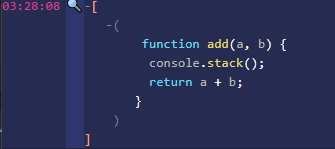
portera.dir(...) displays an interactive list of the properties of the specified object. Try portera.dir(console) or portera.dir(process) also you can enclose a function in an array or object to dump the code,
function add(a, b) {
  console.stack();
  return a + b;
}
console.dir([add]);

Close portera socket
In order to close gracefully portera there is a method called “close”, this sample http server close portera socket at the end
server.on("close", function () {
  console.log("[Server] Stopping ...");
  console.close();
});
Portera server - command line arguments
portera server can be launched with command line arguments.
Use -p or --port to specify a different port
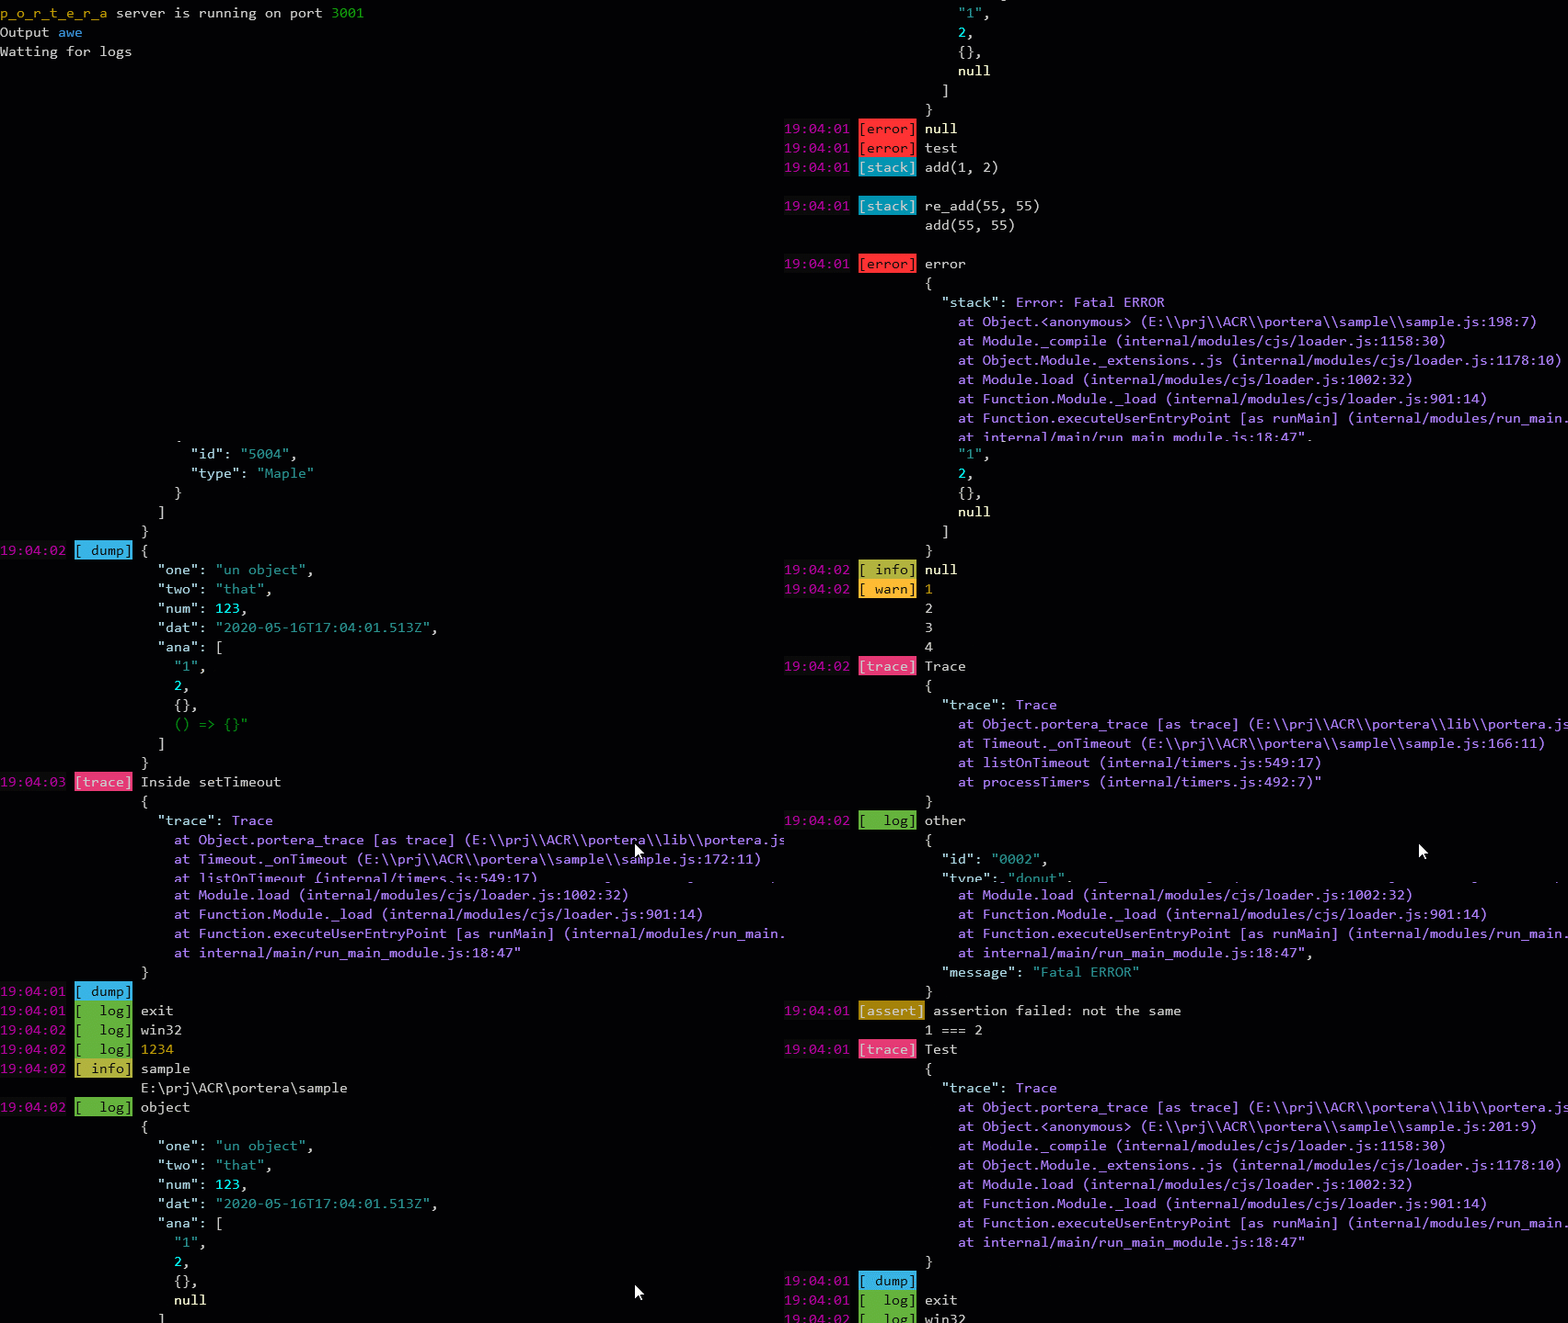
Use -m or --mode to specify two dirent forms of dispaly data in console -m awe by default or -m normal. In normal mode json will be valid json, you can copy & paste to use in another place. Awesome output is more readable otherwise json don´t have a valid format.
Use -s or --silent for silent mode, no console logs.
Sample Console in awe mode by default:

Upgrade
portera is a tool as such I recommend update always to the latest version
npm update -g portera@latest
Motivation
These days I spent more time at home by corona quarantine, time to practice and learn new things. I began to do a sample project in node for the company where I work, it was something that I had have in my mind time ago. The project its a middleware between our different management programs and third part applications, this middleware should contain all bussiness logic necesary by thrird part systems.
When I had this part finished, I was adding a GraphQL interface to learn about it. Then I had a lot of api queries and results from my program and I needed inspect then, to understand how queries were formed and verify the results.
Then I had another problem, it was that I had only my laptop and it have a little screen, between the code editor and browser I didn´t have enaugh screen to show everything. Then I thought that I could use my tablet as a remote log viewer, and here is the result !!!
Note
As always there are a lot of things to-do. this was a hobby for this days, but if you want to do portera better no doubt in contact with me. I’m novice in node, not programming, this is my second program, I’m willing to learn more …
Related Efforts & Thanks
- renderjson - thanks to David Caldwell david@porkrind.org by the great renderjeson plugin, used in portera webpage.
- chartjs - thanks to all chart.js team.
- prism.js - lightweight, robust, elegant syntax highlighting library used in portera.
TODO
- Search
- Add custom renderers & themes
- Groups & Filter
- Timeline
- Tests
Maintainers
You can follow me on twitter:  @romheat
Contributing
Feel free to dive in! Open an issue or submit PRs.
License
MIT © carlos segura


